LECTURE 2:Sensors
Sensors:
Sensors form the interface between the process that is being controlled and the controlling elements. The fundamental purpose of any sensor is to report the state of some variable which characterizes the process. Any measuring device necessarily contains at least one sensing device. Most measuring devices also contain another element, the transducer. The overall structure is shown in figure 2.1.

Figure2.1. The structure of a sensor
A transducer converts information from one form to another. The output or response of the sensor may be in a form that can not easily be processed by the controlling element. The most common output signals form measuring devices are electrical (either voltage or current) or pneumatic ( air pressure).\
Sensors may also be categorized by their response as a function of time. Thus a sensor may be analog (if its response is a continuous function of time), or digital (if the response is in the form of a pulse train, or a function which switches instantaneously between two fixed amplitude states). A special case of digital sensors is a binary sensor, which is basically a switch.
We shall explore the structure of some of the most common sensing devices, used to measure a variety of different phenomena in industrial applications.
What are the physical characteristics in different processes that we may be interested in measuring ?
Temperature:
There are quite a few different temperature sensors, using a variety of physical properties of materials. We are all familiar with mercury thermometers that are used to measure body temperature.
What physical property are they based on ?
Another temperature sensor based on thermal expansion is a bi-metal strip. Is this an analog sensor ?
Most industrial applications, however, use different temperature sensors. The reason for this is: ruggedness, large temperature variation ranges, and ease of interfacing with the transducer, which can then be interfaced with other control hardware. The most common ones are:
• Thermoelements:

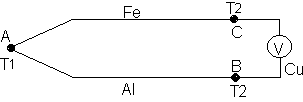
Figure 2.2. A thermoelement.
The thermoelement is based on the Seebeck effect, which observes that an emf is generated resulting in a small current in a circuit composed of wires of two different elements, whose two connecting points are maintained at different temperatures. Since the voltage generated is a function of the temperature difference between the "Hot junction" and the "Cold junction", the temperature at the cold junction must be known when using the thermoelement. The induced emf is of the order of a few microV to a few mV.
• Resistance temperature detectors (RTD's):
The resistance of all conductors varies with temperature. This physical phenomenon can be used to make temperature sensors. RTD's usually use a platinum wire. Also, the resistance is a linear function of temperature measured from a reference temperature (say 0˚ C).
• Thermistors:
Thermistors (thermally sensitive resistors) are made of semiconductor material, and have a negative temperature coefficient (defined as dR/dT), and very high sensitivity. Thermistors are not too accurate, but are commonly used to detect small temperature changes since they are quite sensitive.
Applications: chemical processes, food processing, pasteurization, etc.
Position (or more commonly, displacement):
Most methods to determine displacement and its subsequent derivatives (i.e. velocity, acceleration and jerk) use some means of varying a resistance, inductance or capacitance. The simplest example is a potentiometer, with the resistance varying linearly with displacement.

Variable capacitance sensors are used to measure very small displacements.
Variable inductance displacement sensors are very common in resolvers, which are used in practically every servo-controlled system from robots to machine tool drives. Resolvers measure rotary displacement. The basic principle can be seen in figure 2.3.

Figure 2.3. The principle of a resolver
Velocity:
Linear Velocity
Linear velocity, if needed, is measured by either converting it mechanically to rotational velocity (e.g. using a screw), or by differentiating (automatically) the result of a linear displacement sensor (automatically).
Applications ?
Angular Velocity:
One way to measure angular velocity is via a tachometer. The tachometer once again uses electromotive force generated in a coil rotating in a constant magnetic field. The structure is shown in figure 2.4. The emf generated is proportional to the angular velocity of the rotor.

Figure 2.4. The construction of a tachometer
Applications ?
Acceleration:
Accelerometers are very common in on-line control of machinery to detect runaway components (fault detection). Since inertial force is proportional to acceleration, spring loaded potentiometer heads can be used to measure acceleration (linear).
How does this configuration look ? How does it work ?
Jerk:
Jerk is the third derivative (w.r.t. time) of displacement. High jerk can cause extreme conditions of wear in moving parts of machinery. It can be detected by taking derivatives (automatically) of other motion detectors.
An interesting application is found in some of the earlier switches that activated the seat-belt clamp in automobiles ( they used a mercury switch)
Proximity / Presence:
The most common proximity sensors are used to detect the presence of approaching magnetic materials (mostly iron and its alloys).
A simple way to implement proximity sensors is by using a movable coil which has a low DC current flowing through it. The current makes the coil to act like a magnet, and any approaching magnetic material (due to induced magnetic poles) exerts an attractive force on the coil, which triggers a switch internally.
More commonly, proximity sensors are designed to electronically detect presence of conducting materials. These operate by generating a high frequency electromagnetic field that induces eddy currents in nearby metal targets. The sensor inductance is part of an oscillator circuit. When the target nears the sensor, the oscillations are damped, and the resulting change in oscillator current is made to actuate a solid-state switch.
In more sophisticated applications, vision-based sensors may be used to detect proximity.
Another common presence sensing method is the use of optical sensors. Some common ones are described here:
Photoconductive cells:
Also called photoresistors, these are made of semiconductor materials whose conductivity increases with the intensity of incident light (or in general, electromagnetic radiations). Photoresistive cells use materials like cadmium selenide, cadmium sulfide etc. If the presence of a non-transparent object blocks off some of the incident light on a photoresistive sensor, the voltage across it decreases, thus sensing presence.
Photovoltaic cells:
These are made of materials in which a voltage is generated when they are exposed to electromagnetic radiation. They are most commonly used in solar cells.
Optical sensors for presence or position sensing are composed of two separate units: an optical transmitter, which is usually an LED (light emitting diode), and a receiver, which is either photoresistive, or photovoltaic. Three common configurations are found in practice (shown in figure 2.5). In practice, the choice of configuration depends on space factors and reflectivity of the material whose presence is to be sensed. The diffuse arrangement in figure 2.5 can also be used to discriminate between objects of different colors in some applications.

figure 2.5. Different configurations of optical sensors
Applications: machine tools -clash avoidance, assembly conveyor operations where contact is to be avoided.
Current:
Current is detected using ammeters.
Voltage:
Voltage is detected using galvanometers or voltmeters.
Flow rates:
Many different methods are used to measure volumetric flow rates of fluids.
The simplest method is to introduce a small paddle wheel in the path of the flow. Higher flow rates cause the paddle to rotate faster. Connecting the paddle axle to a tachometer generates the required flow rate sensing.
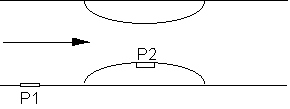
Bernoulli's principle is also used by some flow rate meters. The principle dictates that in streamlined flow of fluids, the pressure decreases as velocity increases. By introducing a small constriction in the pipe through which the fluid is moving, an increase in velocity is obtained, and pressure sensors on before and on the constriction are used to measure the pressure drop. Figure 2.6 shows a schematic.

Figure 2.6. Flow rate sensing using Bernoulli's principle
Applications ?
Mass:
Simple methods of measuring mass use either mechanical springs, or strain gauges (for large mass) that can then be easily interfaced with electronic transducers.
Applications: amount of plastic in an injection mold feeder;
Force:
Forces are measured using dynamometers, which, again, use the deflection of a mechanical spring to create the necessary sensing.
Most force (and also a lot of acceleration) measurements are done using either piezoelectric or piezoresistive sensors.
Piezoresistivity is a property most prominently found in semiconductors (although almost all elements display it weakly). The resistivity of the material changes when it is subjected to a stress (resulting in deformation, or strain). The resistivity increases as the crystal lattice is deformed, and the corresponding change in resistance is measured.
Piezoelectricity is another interesting property of some crystalline substances like quartz. Application of pressure to the crystal creates a voltage across its length. Depending on the deformation (proportional to the applied force), the voltage generated can be of the order of thousands of volts. Piezoelectric sensors are therefore used only for extremely sensitive pressure changes (e.g. detecting minute changes in fluid density caused by acoustic signals).
Applications: microphones, ultrasonic sensors, dynamometers.
Radiation Level: (Geiger Counter)
Sensor Characteristics:
The static accuracy of a sensor indicates how much the sensor signal correctly represents the measured quantity after it stabilizes (i.e. beyond the transient period.) Important static characteristics of sensors include sensitivity, resolution, linearity, zero drift and full-scale drift, range, repeatability and reproducibility.
Sensitivity is a measure of the change in output of the sensor relative to a unit change in the input (the measured quantity.) Example: The speakers you purchase for your home entertainment may have a rated sensitivity of 89 dB Signal Pressure Level per Watt per meter.
Resolution is the smallest amount of change in the input that can be detected and accurately indicated by the sensor. Example: What is the resolution of an ordinary ruler ? Of a Vernier Calipers ?
Linearity is determined by the calibration curve. The static calibration curve plots the output amplitude versus the input amplitude under static conditions. Its degree of resemblance to a straight line describes the linearity.
Drift is the deviation from a specific reading of the sensor when the sensor is kept at that value for a prolonged period of time. The zero drift refers to the change in sensor output if the input is kept steady at a level that (initially) yields a zero reading. Similarly, the full -scale drift is the drift if the input is maintained at a value which originally yields a full scale deflection. Reasons for drift may be extraneous, such as changes in ambient pressure, humidity, temperature etc., or due to changes in the constituents of the sensor itself, such as aging, wear etc.
The range of a sensor is determined by the allowed lower and upper limits of its input or output. Usually the range is determined by the accuracy required. Example:
Sometimes the range may just be determined by physical limitations. Example: a pocket ruler.
Repeatability is defined as the deviation between measurements in a sequence when the object under test is the same and approaches its value from the same direction each time. The measurements have to be made under a short enough time duration so as not to allow significant long term drift. Repeatability is usually specified as a percentage of the sensor range. Example:
Reproducibility is the same as repeatability, except it also incorporates long time lapses between subsequent measurements. The sensor has to be operation between measurements, but must be calibrated. Reproducibility is specified as a percentage of the sensor range per unit of time. Example:
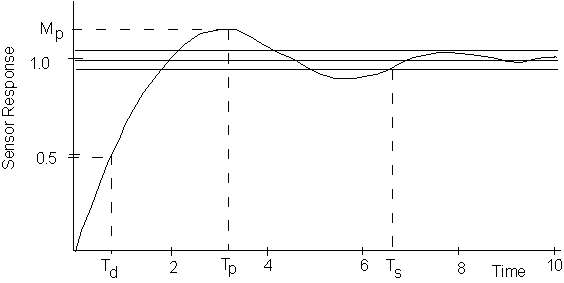
The dynamic characteristics of a sensor represent the time response of the sensor system. Knowledge of these is essential to fruitfully use a sensor. Important common dynamic responses of sensors include rise time, delay time, peak time, settling time percentage error and steady-state error. These are defined following figure 2.7 which shall be used to represent them graphically.

Figure 2.7. Sensor Response Characteristics
Rise time is the time it takes a sensor to pass between 10% to 90% of the steady state response.
Delay time is the time it takes to reach 50% of the steady state value for the first time.
Peak time is the time it takes to reach the maximum reading for the first time for a given excitement.
Settling time is the time it takes the sensor to settle down to within a certain percentage of the steady state value (say ± 1%).
The percentage overshoot is a measure of the peak minus the steady state value, expressed as a percentage of the ssv.
Steady-state error is the deviation of the actual steady-state value from the desired value. It can be corrected by calibration.
Two other terms are used to describe sensor behavior, and shall be described here. These are accuracy and precision.
The accuracy of a system is the difference between the actual and the measured value. The distinction between accuracy and resolution is important. While resolution is the smallest change in measurement value that can be indicated, the accuracy is determined by the actual indication of the sensor and the real value of the measured entity. Thus while resolution depends solely on the sensor hardware, the accuracy is a function of the sensor hardware as well as the measurement environment and other extraneous factors that modify the sensor behavior.
The precision is a statistical measure. It is usually indicated by the standard deviation (or variance) of a set of readings of the sensor for the same input. The distinction between accuracy and precision is clarified by the following figure.

Figure 2.8. Illustration of Accuracy and Precision. The center of the target represents the desired 'true' value.